Thursday, November 30, 2006
Sirius and XM Charts Looking Positive
November 30, 2006
We at Satellite Standard Group like to keep you informed. It was with this in mind that we contacted the folks at
SiriusCharts and asked them if they would be willing to participate on our site with some charting analysis on the sector. They were kind enough to accept, and were even more kind by looking into XMSR as well as Sirius for us. It is our hope to add a regular series on the charting trader, as well as a series on the technical trader. Because we feel it is important that you get varied opinion, we are seeking out individuals who might be interested in working with SSG on a technical outlook for SIRI and XMSR. If you are interested, please send an e-mail to
satellitestandard@gmail.com .
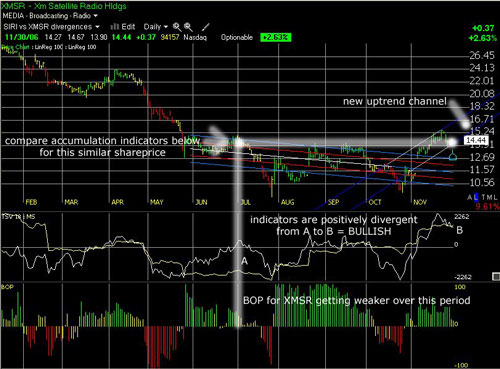
At the request of Satellite Standard Group (SSG), SiriusCharts has been requested to compare the charts of SIRI and XMSR, and asked if XMSR has broken the previous downtrend like Sirius has.
We found that the charts of each company are very similar, and both have positive indicators that bode well for more upside probability in their respective share prices. XMSR did indeed break out of the previous downtrend, and both companies are now comfortably in the new uptrend channels shown in the charts below (Click to enlarge).


Also shown are the previous downtrends defined by the red and blue regression channels. The breakouts are obvious when presented graphically in this fashion, because it is easy to see where they break out of the respective downtrend regression channels. The timeframes are extended by a few months, so the user can compare the correlation of the indicators to previous share prices, and thus observe the positive character the indicators possess at this time. The only obvious difference in the charts is that the Balance of Power Indicator (BOP) is getting weaker in the last few months for XMSR, while the same indicator is getting stronger for SIRI. At this time, we don’t think that is too significant, and think both companies appear poised for more gains.
For more information on what the indicators mean, more graphic examples and charts, and more dialogue on the subject, please visit http://www.siriuscharts.com/.
A Special thanks to SiriusCharts
11/30/2006 11:43:00 PM
SSG Has Merged. You Can Read All Of The Latest SSG Content By Clicking Here


0 Comments:
SSG is not a Financial Advisor. Read Disclosure: HERE
--------------------------------------------------------